How to: Plot a graph using Matplotlib
Matplotlib is a popular python library for plotting graphs.
This guide will show you how to include a Matplotlib graph within your ArupCompute HTML report output.
NOTE
This how-to guide assumes that you have already completed the ArupCompute python tutorial.
Setup
The first thing to do from the terminal is pip install matplotlib
Next add matplotlib to your requirements.txt file.
Code
The key steps are:
- Save the plot as SVG in a temporary file using StringIO
- Use and close figures to ensure that subsequent calls to the function get a fresh canvas to draw on
The example below shows the most important part of the code:
# At top of file
import matplotlib.pyplot as plt
from io import StringIO

# Within your function
fig = plt.figure()
ax = fig.add_subplot()
ax.plot(<plot_something>)

tmpfile = StringIO()
fig.savefig(tmpfile, format='svg')
plt.close(fig)

svg = tmpfile.getvalue()

acr.arupComputeReport_HTML = svg
As a full worked example see this code from the sample library:
def plottingExample(x: float, pow: float) -> ArupComputeResult:
    """Plotting a graph

    An example showcasing how to use MatplotLib to plot a graph

    Args:
        x: The base number
        pow: The power to raise the number to

    Returns:
        y: x raised to pow
    """

    acr = ArupComputeResult()

    ri_pow = ArupComputeResultItem()
    ri_pow.value = x ** pow
    ri_pow.symbol = "pow"
    acr.arupComputeResultItems.append(ri_pow)

    low = 0
    high = 2 * x

    if(x == 0):
        low = -5
        high = 5

    x_vals = []
    y_vals = []

    steps = 20
    stepsize = (high - low) / steps

    for i in range(steps):
        x_val = low + (i * stepsize)

        y_val = x_val ** pow
        x_vals.append(x_val)
        y_vals.append(y_val)

    fig = plt.figure()
    ax = fig.add_subplot()
    ax.plot(x_vals,y_vals)

    tmpfile = StringIO()
    fig.savefig(tmpfile, format='svg')
    plt.close(fig)

    svg = tmpfile.getvalue()

    acr.arupComputeReport_HTML = svg

    return acr
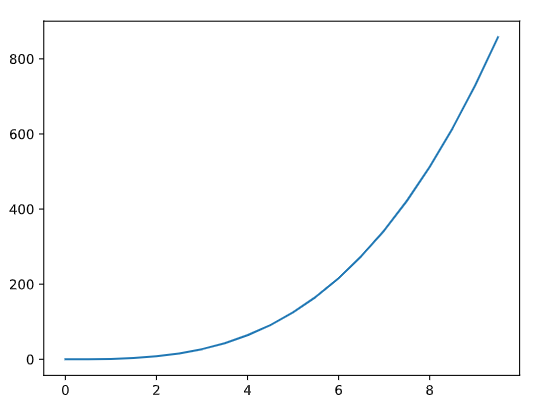
Which produces an output that looks like this (x=5, pow=3):

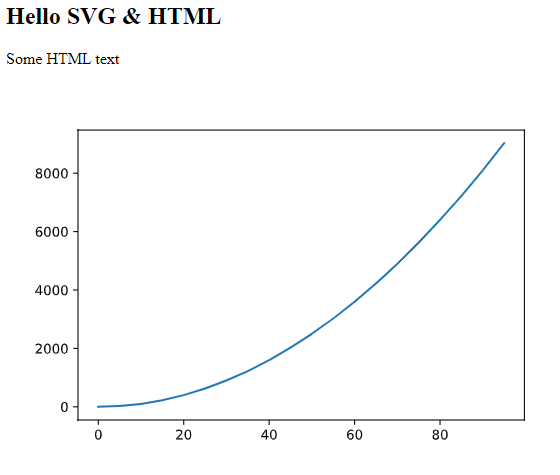
SVG is a native part of HTML, so can be inserted directly.
<h2>Hello SVG & HTML</h2>
<P>Some HTML text</p>
<svg>
  ...
</svg>
Would look like this:

Thanks
- Thomas Bush for figuring out the usage of the
StringIOlibrary for the temporary file - Sebastien Cote for working out how to use figures to enable a clean canvas for each new run