Pandas 🐼
pandas is a python library which can be very helpful for working with tables of data with your calculations.
There is extensive documentation and pandas is widely used, so there's lots of help on Stack Overflow
We will go through a short example.
Step 1 - Installation
Firstly you need to install the pandas package. This should be as simple as:
python -m pip install pandas
Step 2 - Create a DataFrame
Create DataFrame with inputs and outputs from DesignCheck calculations.
import arupcomputepy

# set up our connection ArupCompute
jobNumber = '00000000' # for testing only - please use a real job number
connection = arupcomputepy.Connection(jobNumber)

calcID = 5459313 # DesignCheck2 v145.0.17 Structural.EC.Calcs.Concrete > Slab overall depth

l_input = [5, 5.5, 6, 6.5, 7, 7.5, 8, 8.5, 9, 9.5, 10]
slab_type_input = ['OneWaySolidSlab_SingleSpan'] * 11
q_k_input = [3.1] * 11
g_ksdl_input = [1.2] * 11

# Note that we use lists of input data for a batch calculation
variables = {
    'ID' : list(range(1,12)),
    'slab_type' : slab_type_input,
    'q_k' : q_k_input,
    'g_ksdl' : g_ksdl_input,
    'l' : l_input
}

# Note that we need to set the variable isBatch = True
response = arupcomputepy.MakeCalculationRequest(connection, calcID, isBatch=True, variables=variables)

import pandas as pd

# Create DataFrame
df = pd.DataFrame(columns=['Slab Type', 'q_k (kPa)', 'g_ksdl (kPa)', 'Span (m)', 'Depth (mm)'])

for i in range(len(response)):
    df.loc[i] = [slab_type_input[i], q_k_input[i], g_ksdl_input[i], l_input[i], response[i]['h']]  # 'h' = cross section depth 'mm'
Hence, df contains:
| Slab Type | q_k (kPa) | g_ksdl (kPa) | Span (m) | Depth (mm) | |
|---|---|---|---|---|---|
| 0 | OneWaySolidSlab_SingleSpan | 3.1 | 1.2 | 5 | 173.38 |
| 1 | OneWaySolidSlab_SingleSpan | 3.1 | 1.2 | 5.5 | 190.30 |
| 2 | OneWaySolidSlab_SingleSpan | 3.1 | 1.2 | 6 | 207.22 |
| 3 | OneWaySolidSlab_SingleSpan | 3.1 | 1.2 | 6.5 | 226.15 |
| 4 | OneWaySolidSlab_SingleSpan | 3.1 | 1.2 | 7 | 245.08 |
| 5 | OneWaySolidSlab_SingleSpan | 3.1 | 1.2 | 7.5 | 269.86 |
| 6 | OneWaySolidSlab_SingleSpan | 3.1 | 1.2 | 8 | 294.64 |
| 7 | OneWaySolidSlab_SingleSpan | 3.1 | 1.2 | 8.5 | 322.34 |
| 8 | OneWaySolidSlab_SingleSpan | 3.1 | 1.2 | 9 | 350.04 |
| 9 | OneWaySolidSlab_SingleSpan | 3.1 | 1.2 | 9.5 | 390.93 |
| 10 | OneWaySolidSlab_SingleSpan | 3.1 | 1.2 | 10 | 431.82 |
Step 3 - Use DataFrame
There are many ways pandas DataFrame's can be used. These include:
Tabulating Data for Reports
For example, DataFrames can be converted to HTML, and so easily combined into reports.
htmlConcat = ''
htmlConcat += response.arupComputeReport_HTML # DesignCheck output report
htmlConcat += df.to_html() # DataFrame converted to HTML

import arupcomputepy.pdf
arupcomputepy.pdf.Create(htmlConcat, "BC", "htmlConcat.pdf", True)
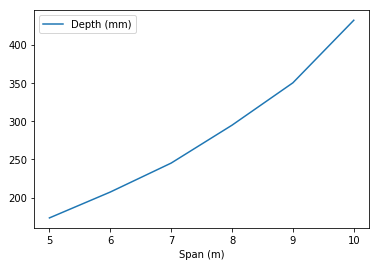
Quick Plotting
df.plot(x='Span (m)', y='Depth (mm)')
