Plot graph 📈
The code written in this section is executed in a Jupyter Notebook, however the code for use in a python script will be very similar, if not identical.
Step 1 - Installation
Ensure you have matplotlib installed.
This should be as simple as running the following commands in your Command Prompt:
python -m pip install -U pip
python -m pip install -U matplotlib
Step 2 - Batch calculation
For multiple calculation calls, ArupCompute works best with batch requests.
import arupcomputepy
import tempfile
import matplotlib.pyplot as plt
import os

# set up our connection ArupCompute
jobNumber = '00000000' # for testing only - please use a real job number
connection = arupcomputepy.Connection(jobNumber)

calcID = 5459313 # DesignCheck2 v145.0.17 Structural.EC.Calcs.Concrete > Slab overall depth

# Note that we use lists of input data for a batch calculation
spans = [5, 5.5, 6, 6.5, 7, 7.5, 8, 8.5, 9, 9.5, 10]
variables = {
    'ID' : [1, 2, 3, 4, 5, 6, 7, 8, 9, 10, 11],
    'slab_type' : ['OneWaySolidSlab_SingleSpan', 'OneWaySolidSlab_SingleSpan', 'OneWaySolidSlab_SingleSpan', 'OneWaySolidSlab_SingleSpan', 'OneWaySolidSlab_SingleSpan', 'OneWaySolidSlab_SingleSpan', 'OneWaySolidSlab_SingleSpan', 'OneWaySolidSlab_SingleSpan', 'OneWaySolidSlab_SingleSpan', 'OneWaySolidSlab_SingleSpan', 'OneWaySolidSlab_SingleSpan'],
    'q_k' : [3, 3, 3, 3, 3, 3, 3, 3, 3, 3, 3],
    'g_ksdl' : [1, 1, 1, 1, 1, 1, 1, 1, 1, 1, 1],
    'l' : spans
}

# Note that we need to set the variable isBatch = True
response = arupcomputepy.MakeCalculationRequest(connection, calcID, isBatch=True, variables=variables)
Step 3 - Create lists of x- and y-series
y_vals = []
for item in response:
    y_vals.append(item['h']) # 'h' = cross section depth 'mm'
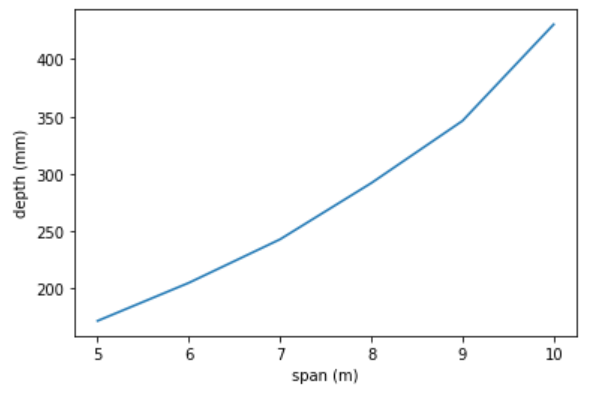
Step 4 - Plot graph
ax = plt.axes()

ax.plot(spans, y_vals)
plt.xlabel('Span (m)')
plt.ylabel('Depth (mm)')

plt.show()

# if you want to save the figure
path = os.path.join(tempfile.gettempdir(),'arupcomputepy','GraphExample.png') # temporary file location for demonstration purposes
print(path)
plt.savefig(path)

tip
matplotlib plots are very flexible and customisable, see the documentation for more.